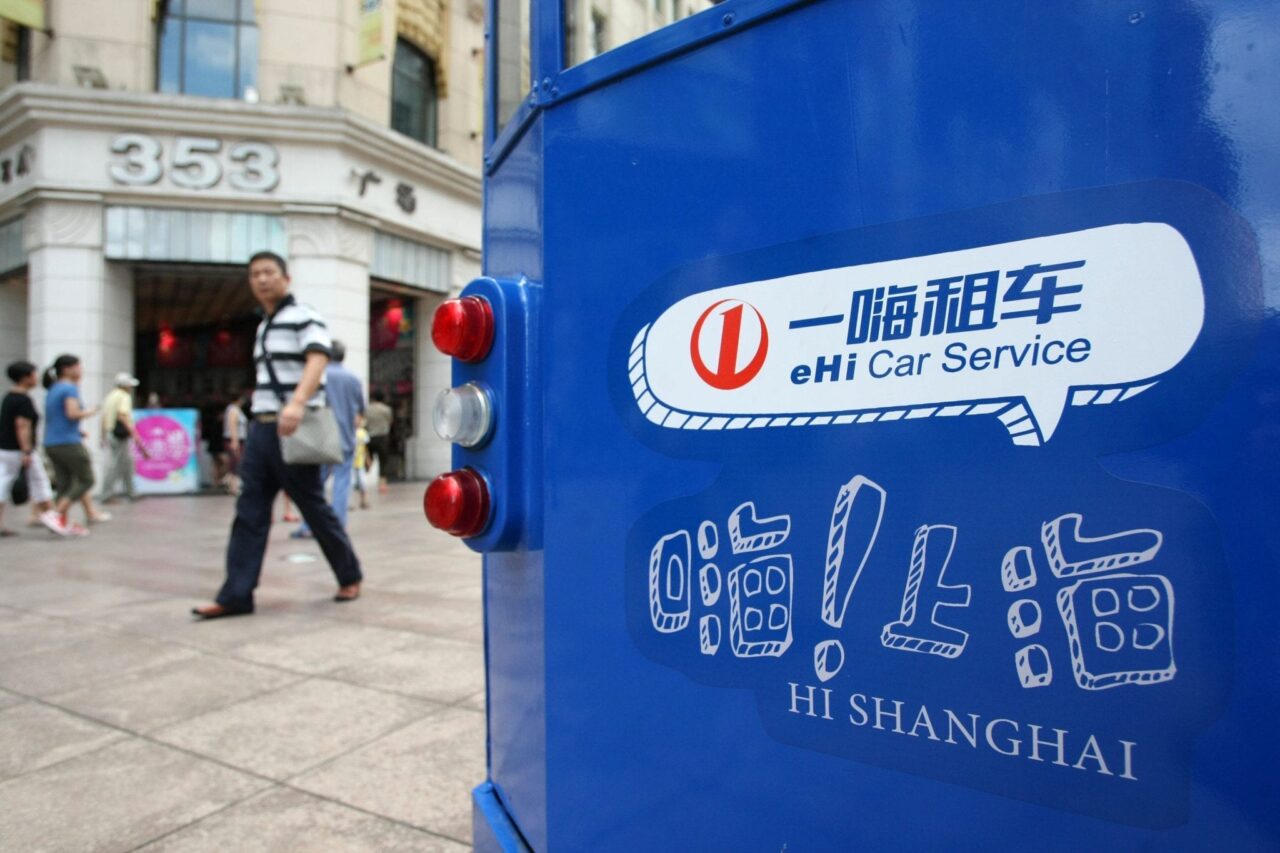
eHi Car Services Limited rentals and car services provider in China, today announced its unaudited financial results for the third quarter ended September 30, 2016.
Third Quarter 2016 Highlights
|
Three months ended September 30, |
Year-Over-Year |
||||
|
(RMB ‘000) |
2015 |
2016 |
Comparison |
||
|
Car rentals |
300,700 |
464,271 |
54.4% |
||
|
Car services |
93,080 |
117,783 |
26.5% |
||
|
Total Net Revenues |
393,780 |
582,054 |
47.8% |
||
Gross profit[2] increased by 83.9% year-over-year to RMB165.7 million (US$24.8 million) for the third quarter of 2016, from RMB90.1 million for the third quarter of 2015. Gross profit margin[2] increased to 28.5% for the third quarter of 2016, from 22.9% for the third quarter of 2015.
|
[1] The Company’s business is conducted in China and substantially all of its revenues are denominated in Renminbi (RMB). However, this earnings announcement contains translations of RMB amounts into U.S. dollars (US$) at specified rates solely for the convenience of the reader. Unless otherwise noted, all translations from RMB to U.S. dollars are made at a rate of RMB6.6685 to US$1.00, the effective noon buying rate as of September 30, 2016 in The City of New York for cable transfers of RMB as certified for customs purposes by the Federal Reserve Bank of New York. |
|
[2] Gross profit is defined as net revenues less cost of net revenues (vehicle operating expenses). Gross profit margin is defined as the percentage representing gross profit divided by net revenues. |
|
[3] Non-GAAP adjusted EBIT is defined as net income before share-based compensation, interest expenses, interest income, provision for income taxes, gains from waiver of warrants and gains from sale of cost method investment. For more information, refer to “About Non-GAAP Financial Measures” and “Reconciliation of GAAP and Non-GAAP Results” at the end of this press release. Non-GAAP adjusted EBIT margin is defined as the percentage representing Non-GAAP adjusted EBIT divided by net revenues. |
|
[4] Non-GAAP adjusted EBITDA is defined as net income before depreciation and amortization, share-based compensation, interest expenses, interest income, provision for income taxes, gains from waiver of warrants and gains from sale of cost method investment. For more information, refer to “About Non-GAAP Financial Measures” and “Reconciliation of GAAP and Non-GAAP Results” at the end of this press release. Non-GAAP adjusted EBITDA margin is defined as the percentage representing Non-GAAP adjusted EBITDA divided by net revenues. |
|
[5] “Average available fleet size” is calculated by dividing the aggregate number of days in which the Company’s fleet was in operation during a given period by the total number of days during the same period. In determining the size of the Company’s fleet in operation, eHi includes all vehicles in its car rentals and/or car services fleets except for vehicles that have been written off in accordance with its accounting policy and vehicles that have not been consistently made available for rent and that it may consider to dispose of when appropriate opportunities arise. |
|
[6] “RevPAC” refers to average daily net revenue per available car, which is calculated by dividing the net revenues during a given period by the aggregate number of days in which the Company’s fleet was in operation during the same period. |
|
Average Available Fleet Size |
RevPAC (RMB) |
||||||||||
|
2015Q3 |
2016Q3 |
Year-Over-Year Comparison |
2015Q3 |
2016Q3 |
Year-Over-Year Comparison |
||||||
|
Car rentals |
26,200 |
39,227 |
49.7% |
125 |
129 |
3.2% |
|||||
|
Car services |
2,299 |
2,515 |
9.4% |
440 |
509 |
15.7% |
|||||
|
Total |
28,499 |
41,742 |
46.5% |
150 |
152 |
1.3% |
|||||
|
[7] “Fleet utilization rate” refers to the aggregate transaction days for the Company’s car rental fleet during a given period divided by the aggregate days the car rental fleet was in operation during the same period. |
|
[8] “Period-end fleet size” refers to the aggregate number of vehicles in the Company’s car rentals and car services fleets as of the last day of a given period which the Company holds legal title to and reflects in its balance sheet, including vehicles that are currently missing but have not been written off in accordance with its accounting policy. The period-end fleet size as of September 30, 2016 excluded 144 vehicles which the Company had written off from its balance sheet in accordance with its accounting policy. |
Mr. Ray Zhang, eHi’s Chairman and Chief Executive Officer, said, “Our business continued to thrive during the third quarter, leading to both strong top-line growth and significant improvement in profitability. As a fast-growing company, we are committed to driving ongoing operating leverage and are well-positioned to capture the growing demand from China’s rapidly rising domestic tourism and business-related travel.”
“The recent regulations regarding online car-hailing business in China, we believe, provide us with greater potential to explore business and strategic cooperation opportunities to enhance our competitive position. Looking ahead, we remain focused on continuing to execute on our growth plan and achieving our strategic objectives,” Mr. Zhang concluded.
Mr. Colin Sung, eHi’s Chief Financial Officer, said, “We are pleased to report strong third quarter results with net revenues increasing by 47.8% year-over-year, while recording 269.5% bottom-line growth from the prior-year period. Notably, our continued focus on operating efficiency and cost control measures contributed to broad-based margin improvement. Our gross margin and non-GAAP adjusted EBITDA margin both reached record-highs of 28.5% and 45.4%, respectively. Our financial discipline is well-established, and we remain committed to prudent expansion and a balanced approach between growth and profitability.”
Third Quarter 2016 Financial Results
Net revenues for the third quarter of 2016 were RMB582.1 million (US$87.3 million), up 47.8% year-over-year, attributable to increased net revenues from both car rentals and car services.
Net revenues from car rentals for the third quarter of 2016 were RMB464.3 million (US$69.6 million), up 54.4% year-over-year, primarily driven by the growing average available fleet size for car rentals in response to customer demand.
Net revenues from car services for the third quarter of 2016 were RMB117.8 million (US$17.7 million), up 26.5% year-over-year, primarily driven by the increased car services RevPAC as we provided services to more business clients.
Cost of revenues (vehicle operating expenses) for the third quarter of 2016 was RMB416.4 million (US$62.4 million), up 37.1% year-over-year, primarily driven by increased depreciation and labor costs.
In the third quarter of 2016, 486 used vehicles were disposed of, and 358 used vehicles were under sales contracts pending title transfer. The Company recognized a disposal loss of RMB0.3 million (US$0.04 million) in aggregate for these 844 vehicles. In addition, a disposal gain of RMB0.7 million (US$0.1 million), which was unrecognized in the previous quarters, was recognized in the third quarter of 2016 as a result of the completion of title transfer during such period. The disposal loss and gain were both recognized as adjustments to the vehicle-related depreciation expense as part of the cost of revenues.
Gross profit for the third quarter of 2016 was RMB165.7 million (US$24.8 million), up 83.9% year-over-year. Gross profit margin for the third quarter of 2016 was 28.5%, compared with 22.9% for the third quarter of 2015. Gross profit margin improvement was due to certain cost controls primarily in vehicle insurance, and to a lesser extent, in vehicle repair and maintenance as well as labor costs, in connection with enhanced economies of scale and operating efficiency.
Selling and marketing expenses for the third quarter of 2016 were RMB28.5 million (US$4.3 million), up 81.8% year-over-year, primarily due to increased channel marketing and promotion fees as the Company expanded branding and channel promotion activities during such period.
General and administrative expenses for the third quarter of 2016 were RMB63.1 million (US$9.5 million), up 38.6% year-over-year, primarily due to increased employee-related costs including salaries and welfare expenses as a result of increased headcount, as well as a foreign exchange loss in the third quarter of 2016 compared with a foreign exchange gain in the third quarter of 2015.
Profit from operations for the third quarter of 2016 was RMB77.0 million (US$11.5 million), up 124.2% year-over-year.
Interest expense for the third quarter of 2016 was RMB55.7 million (US$8.3 million), up 79.5% year-over-year, primarily attributable to the interest expense associated with the Company’s senior unsecured notes of US$200 million due 2018.
Net income for the third quarter of 2016 was RMB22.3 million (US$3.3 million), up 269.5% from RMB6.0 millionfor the third quarter of 2015. Net income margin for the third quarter of 2016 was 3.8%, compared with 1.5% for the third quarter of 2015.
Basic and diluted earnings per ADS for the third quarter of 2016 were RMB0.32 (US$0.05) each, compared with basic and diluted earnings per ADS of RMB0.09 (US$0.01) each for the third quarter of 2015.
Non-GAAP adjusted EBIT for the third quarter of 2016 was RMB80.6 million (US$12.1 million), up 97.4% year-over-year. Non-GAAP adjusted EBIT margin for the third quarter of 2016 was 13.8%, compared with 10.4% for the third quarter of 2015.
Non-GAAP adjusted EBITDA for the third quarter of 2016 was RMB264.5 million (US$39.7 million), up 60.0% year-over-year. Non-GAAP adjusted EBITDA margin for the third quarter of 2016 was 45.4%, compared with 42.0% for the third quarter of 2015.
As of September 30, 2016, the Company’s cash, cash equivalents and restricted cash balance was RMB1.5 billion (US$223.7 million).
Recent Development
On August 30, 2016, the Company entered into a US$150 million syndicated loan facility agreement. This loan facility agreement includes an initial facility of US$110 million and a greenshoe facility of US$40 million. The loan facilities have a three-year term and will be repaid in installments. The interest margin is priced at 350 basis points per annum over LIBOR. Deutsche Bank AG, Singapore Branch is acting as the original mandated lead arranger of the loan facilities. The Company had fully drawn down the US$150 million facility as of September 27, 2016, and used part of the proceeds for repaying certain existing indebtedness with high interest rates. The remaining proceeds will be used for funding capital expenditures and other general corporate purposes of the Company.
Outlook
The Company estimates that net revenues for the full year of 2016 will range from RMB2.1 billion to RMB2.2 billion, and total period-end fleet size will reach approximately 57,000 vehicles as of December 31, 2016. This outlook reflects the Company’s current and preliminary view, which is subject to change.